Why Datadog Is Our Web Team's Best Friend
We'll go over the features we use and the benefits they provide.


The BigCommerce web team started using Datadog about a year ago, and it has been invaluable to us. It greatly improved our observability of the corporate website, allowing us to debug issues quickly and resolve incidents faster.
Recent Article: How We Swapped Out Our Service Mesh, without Anyone Noticing
For those who don’t know, Datadog is a monitoring platform for cloud applications. They offer a ton of integrations, making it easy to set up. We are currently using it for the corporate website frontend, which is a Next.js application hosted on Vercel.
This blog post will go over the features we use and the benefits they provide.
Logging
Logging is the most important feature we use. It allows us to see errors from across the application, whether they occur in the browser or one of our serverless API endpoints.
We started by setting up Datadog’s integration with Vercel. This took care of most of our logging needs, but we were still missing browser logs. To handle this, we used the Datadog Browser SDK, which allows us to send all browser errors to Datadog:
datadogLogs.init({
  beforeSend: (log) => {
    log.vercel_host = process.env.NEXT_PUBLIC_VERCEL_URL;
  },
  clientToken: process.env.NEXT_PUBLIC_DATADOG_CLIENT_TOKEN,
  env: process.env.NEXT_PUBLIC_DATADOG_ENV,
  forwardErrorsToLogs: true,
  sampleRate: 100,
  silentMultipleInit: true,
  site: 'datadoghq.com',
});
Each log is automatically populated with important metadata (host, path, status code, etc.). However, there are some scenarios where it misses certain data or something custom is needed. This is where Pipelines come in.
Pipelines
Pipelines allow you to preprocess logs before they show up in the Log Explorer. Each pipeline contains a series of processors that get executed in order.
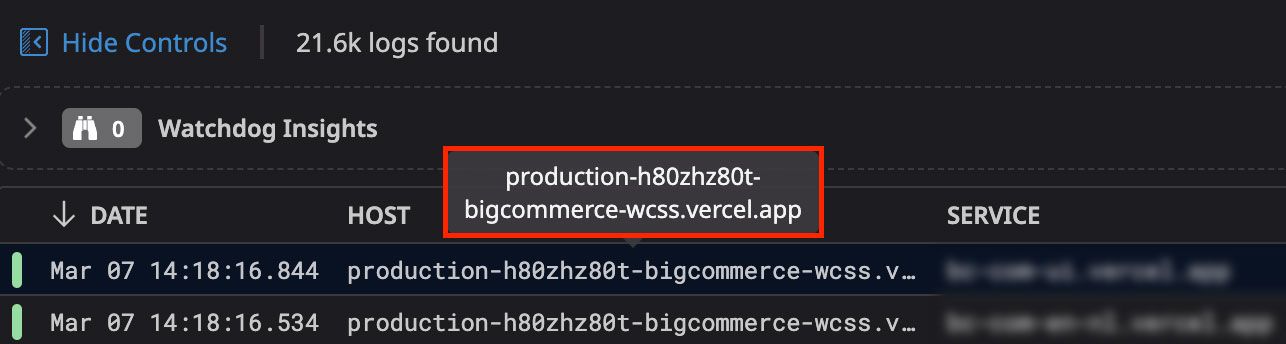
For example, our logs coming through the Vercel integration were missing environment information. From looking at one of the logs, we noticed that the environment information is prefixed in the 𝚟𝚎𝚛𝚌𝚎𝚕.𝚊𝚙𝚙 hostname:
To solve this, we set up a custom pipeline that uses two processors: a Grok Parser and a Remapper. The Grok Parser parses the environment value and sets an 𝚎𝚗𝚟 attribute with the value. Next, the Remapper reads the 𝚎𝚗𝚟 attribute and sets it as a tag on the log:
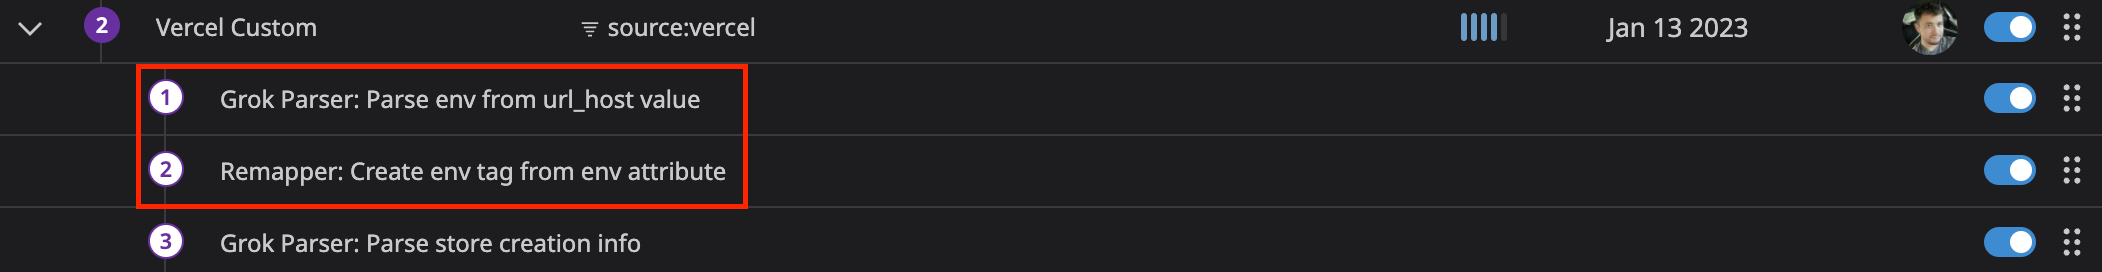
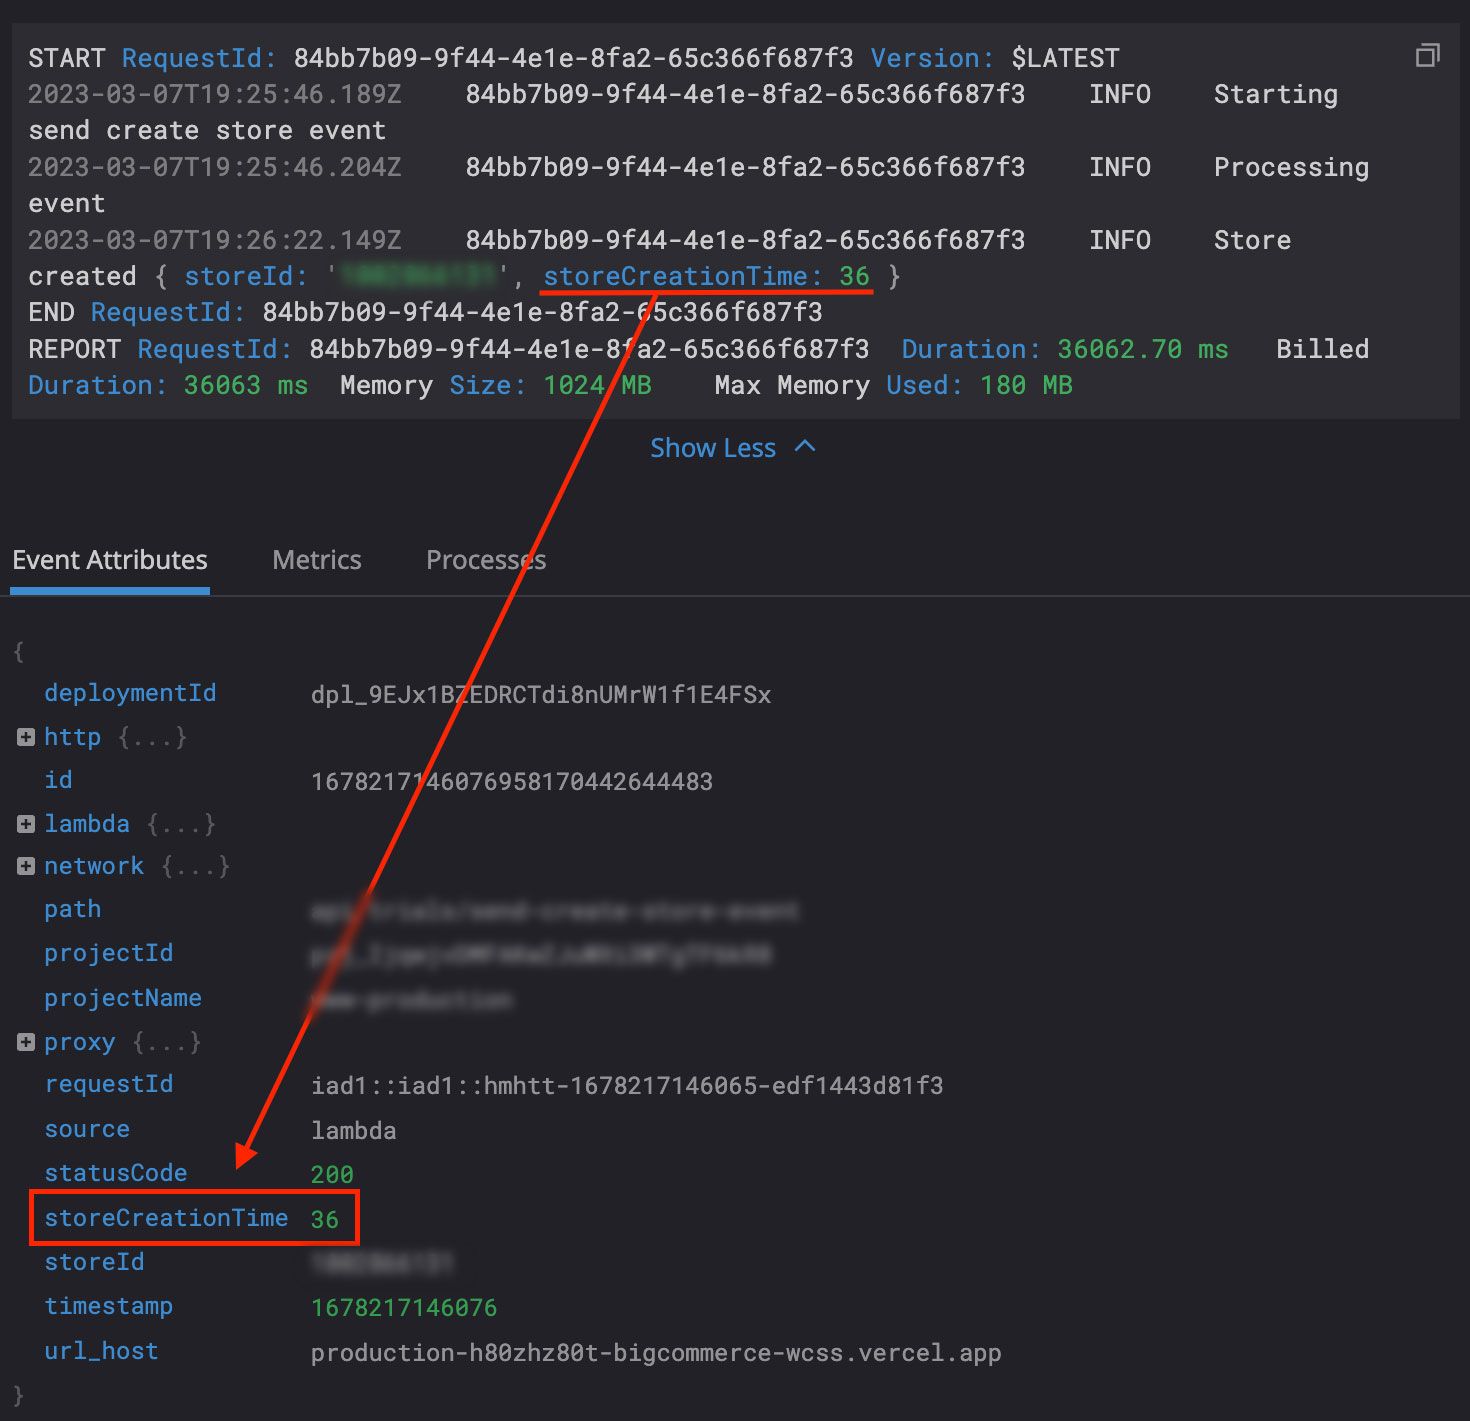
There’s another Grok Parser in this pipeline that extracts the store creation time from our trial creation logs (more on that below).
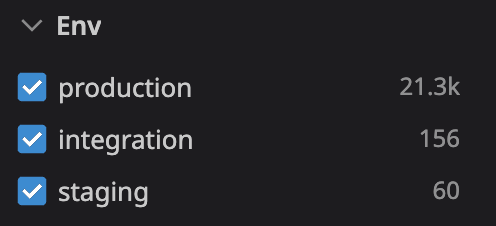
This tag allows us to search and group logs per environment:
Exclusion Filters
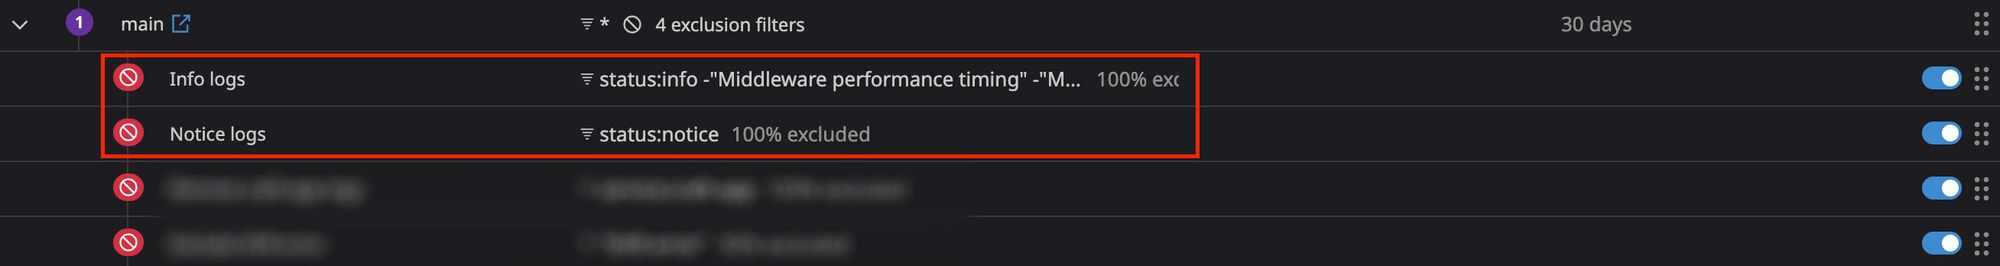
There are certain logs we receive that are unnecessary and end up diluting our useful logs. Exclusion Filters allow you to exclude logs before they show up in the Log Explorer. Excluded logs do not count toward your quota.
In our case, the Vercel integration automatically sends info and notice-level logs, which don’t provide us with much value. So we simply add them to our exclusion list, and we don’t have to worry about them:
Metrics
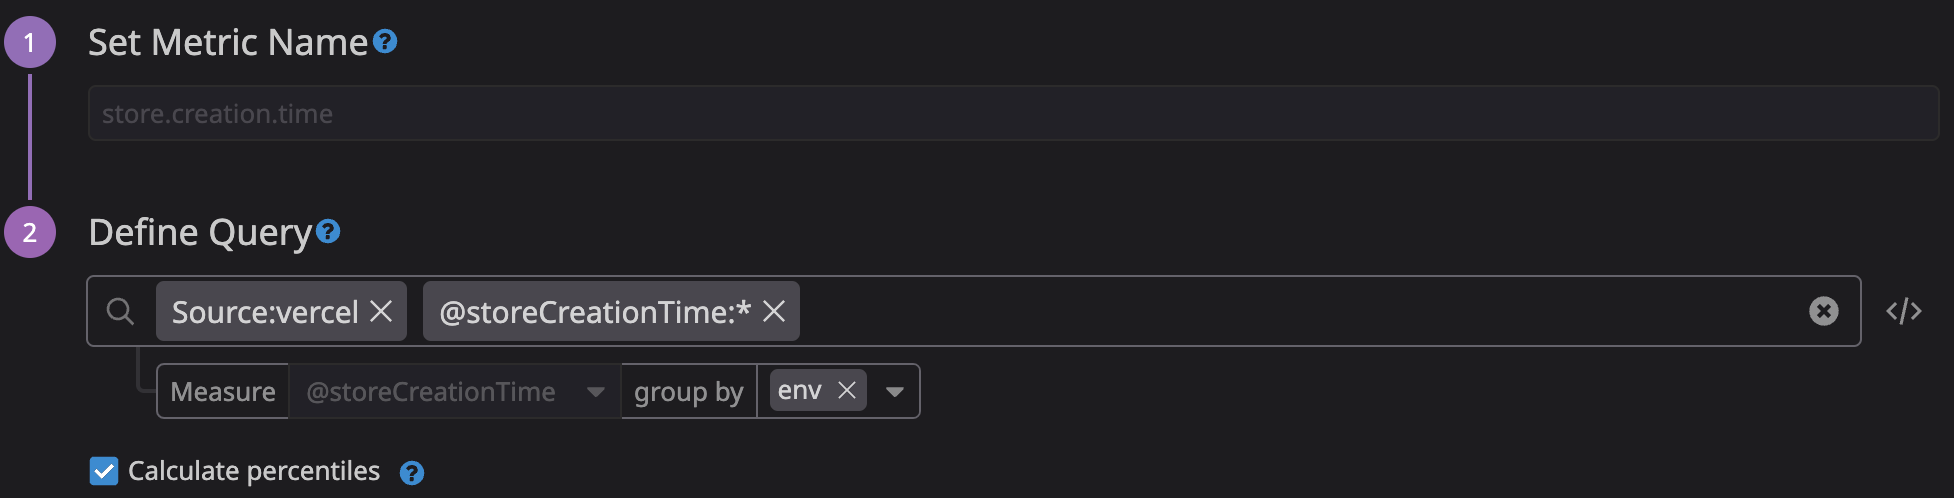
Metrics allow you to extract numerical values from logs and track them over time via graphs. We use a metric for tracking trial store creation time since the duration is already set as an attribute (via the processor mentioned above):
We simply extract it using a metric:
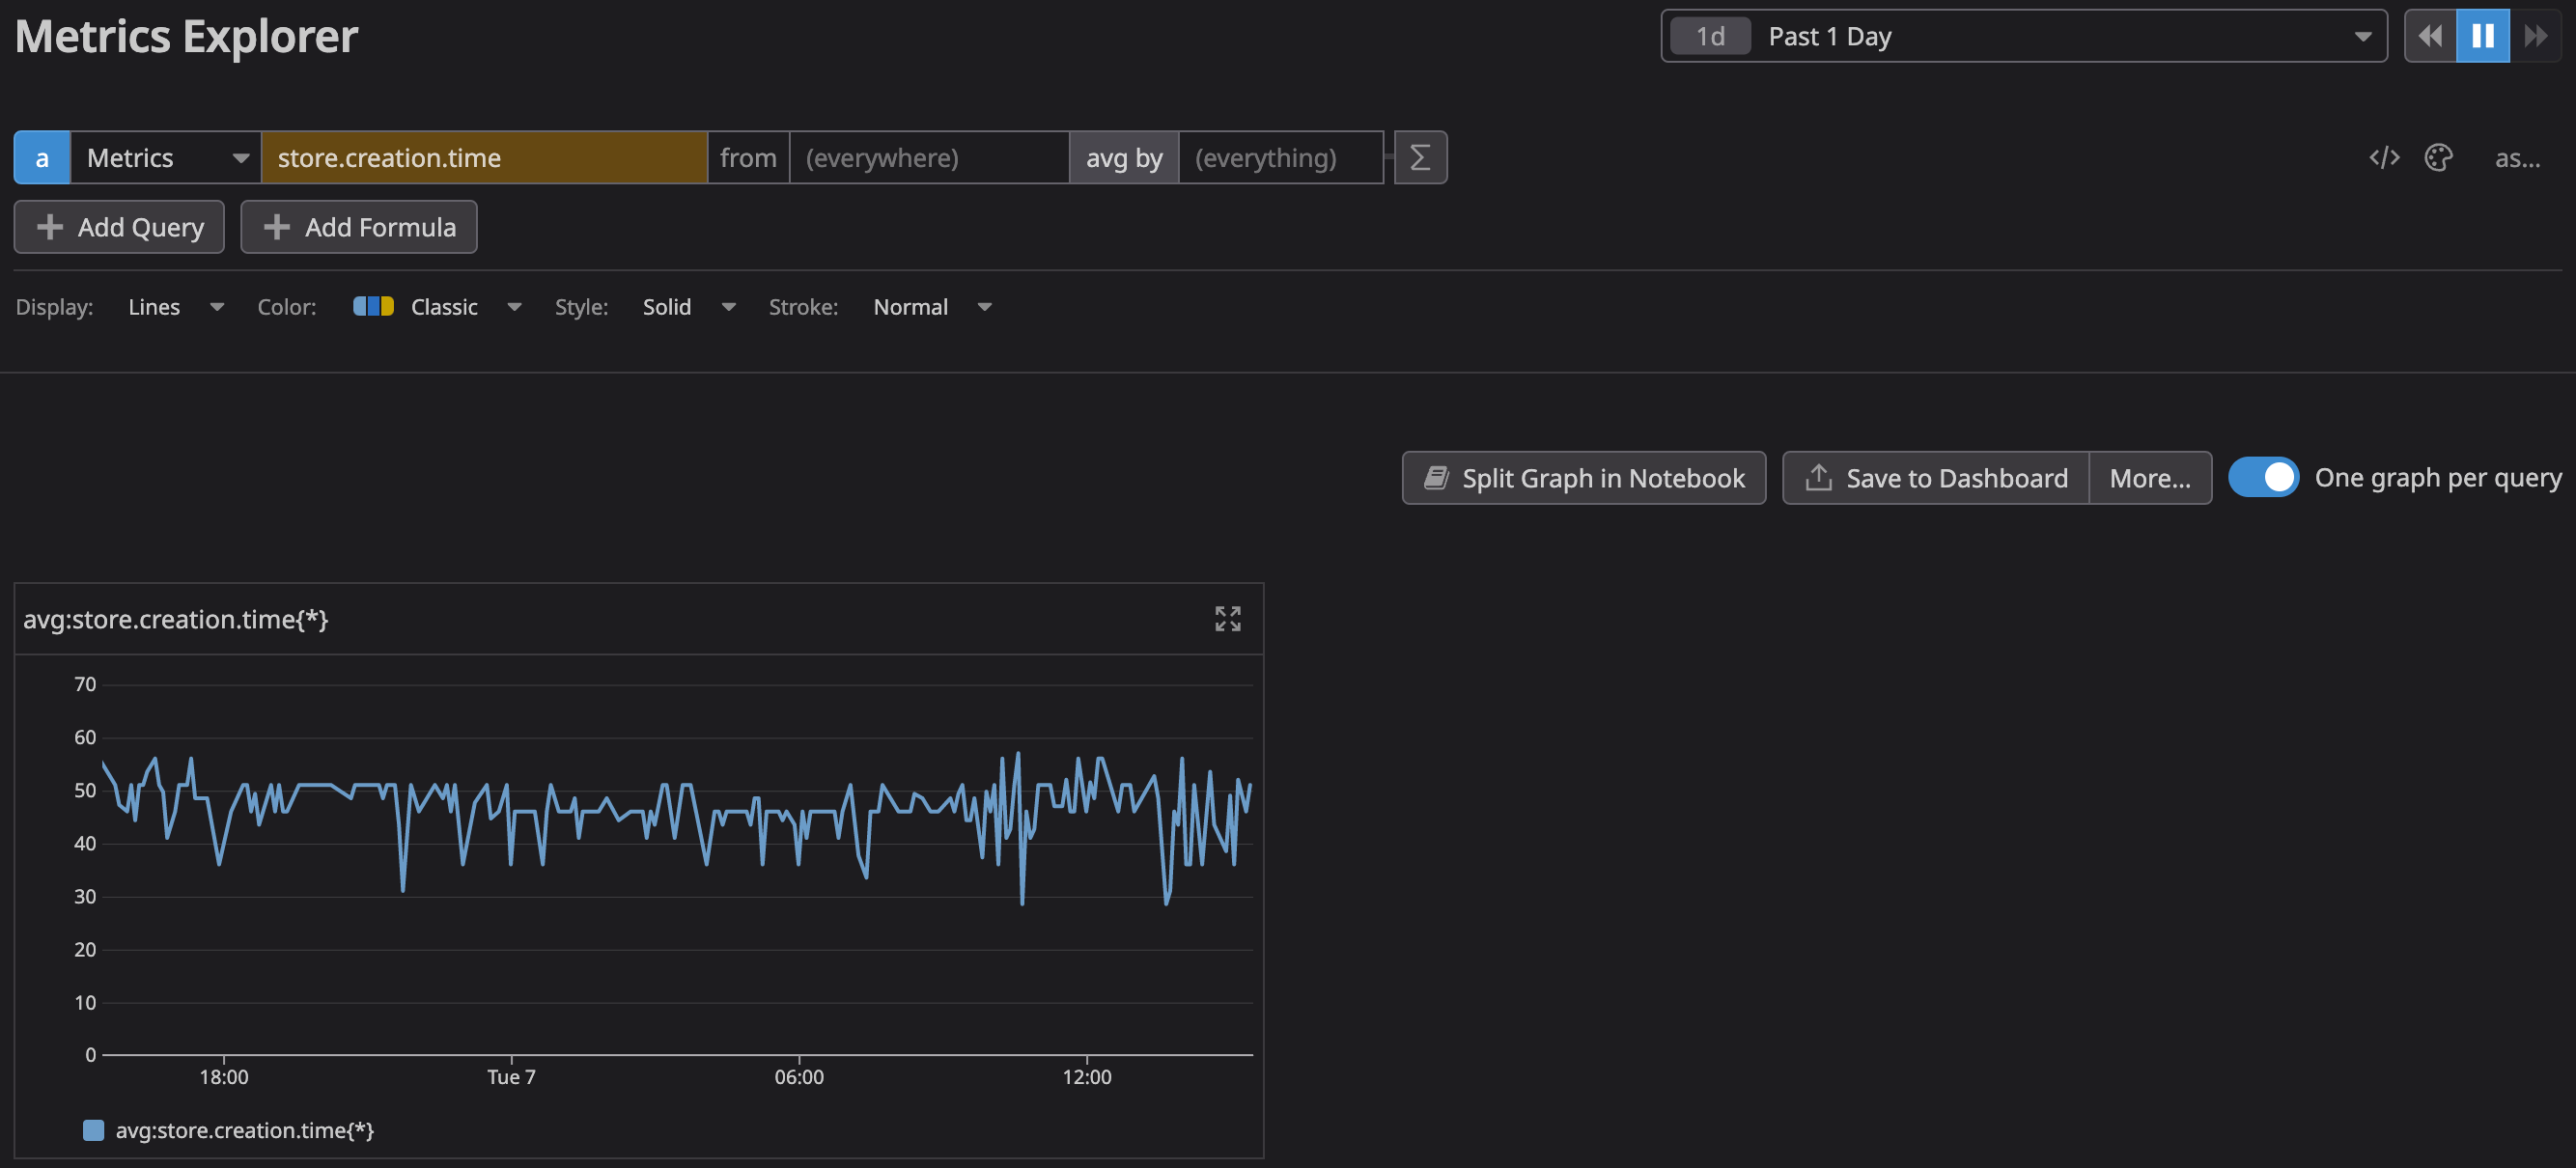
Which then allows us to track it in a dashboard or graph:
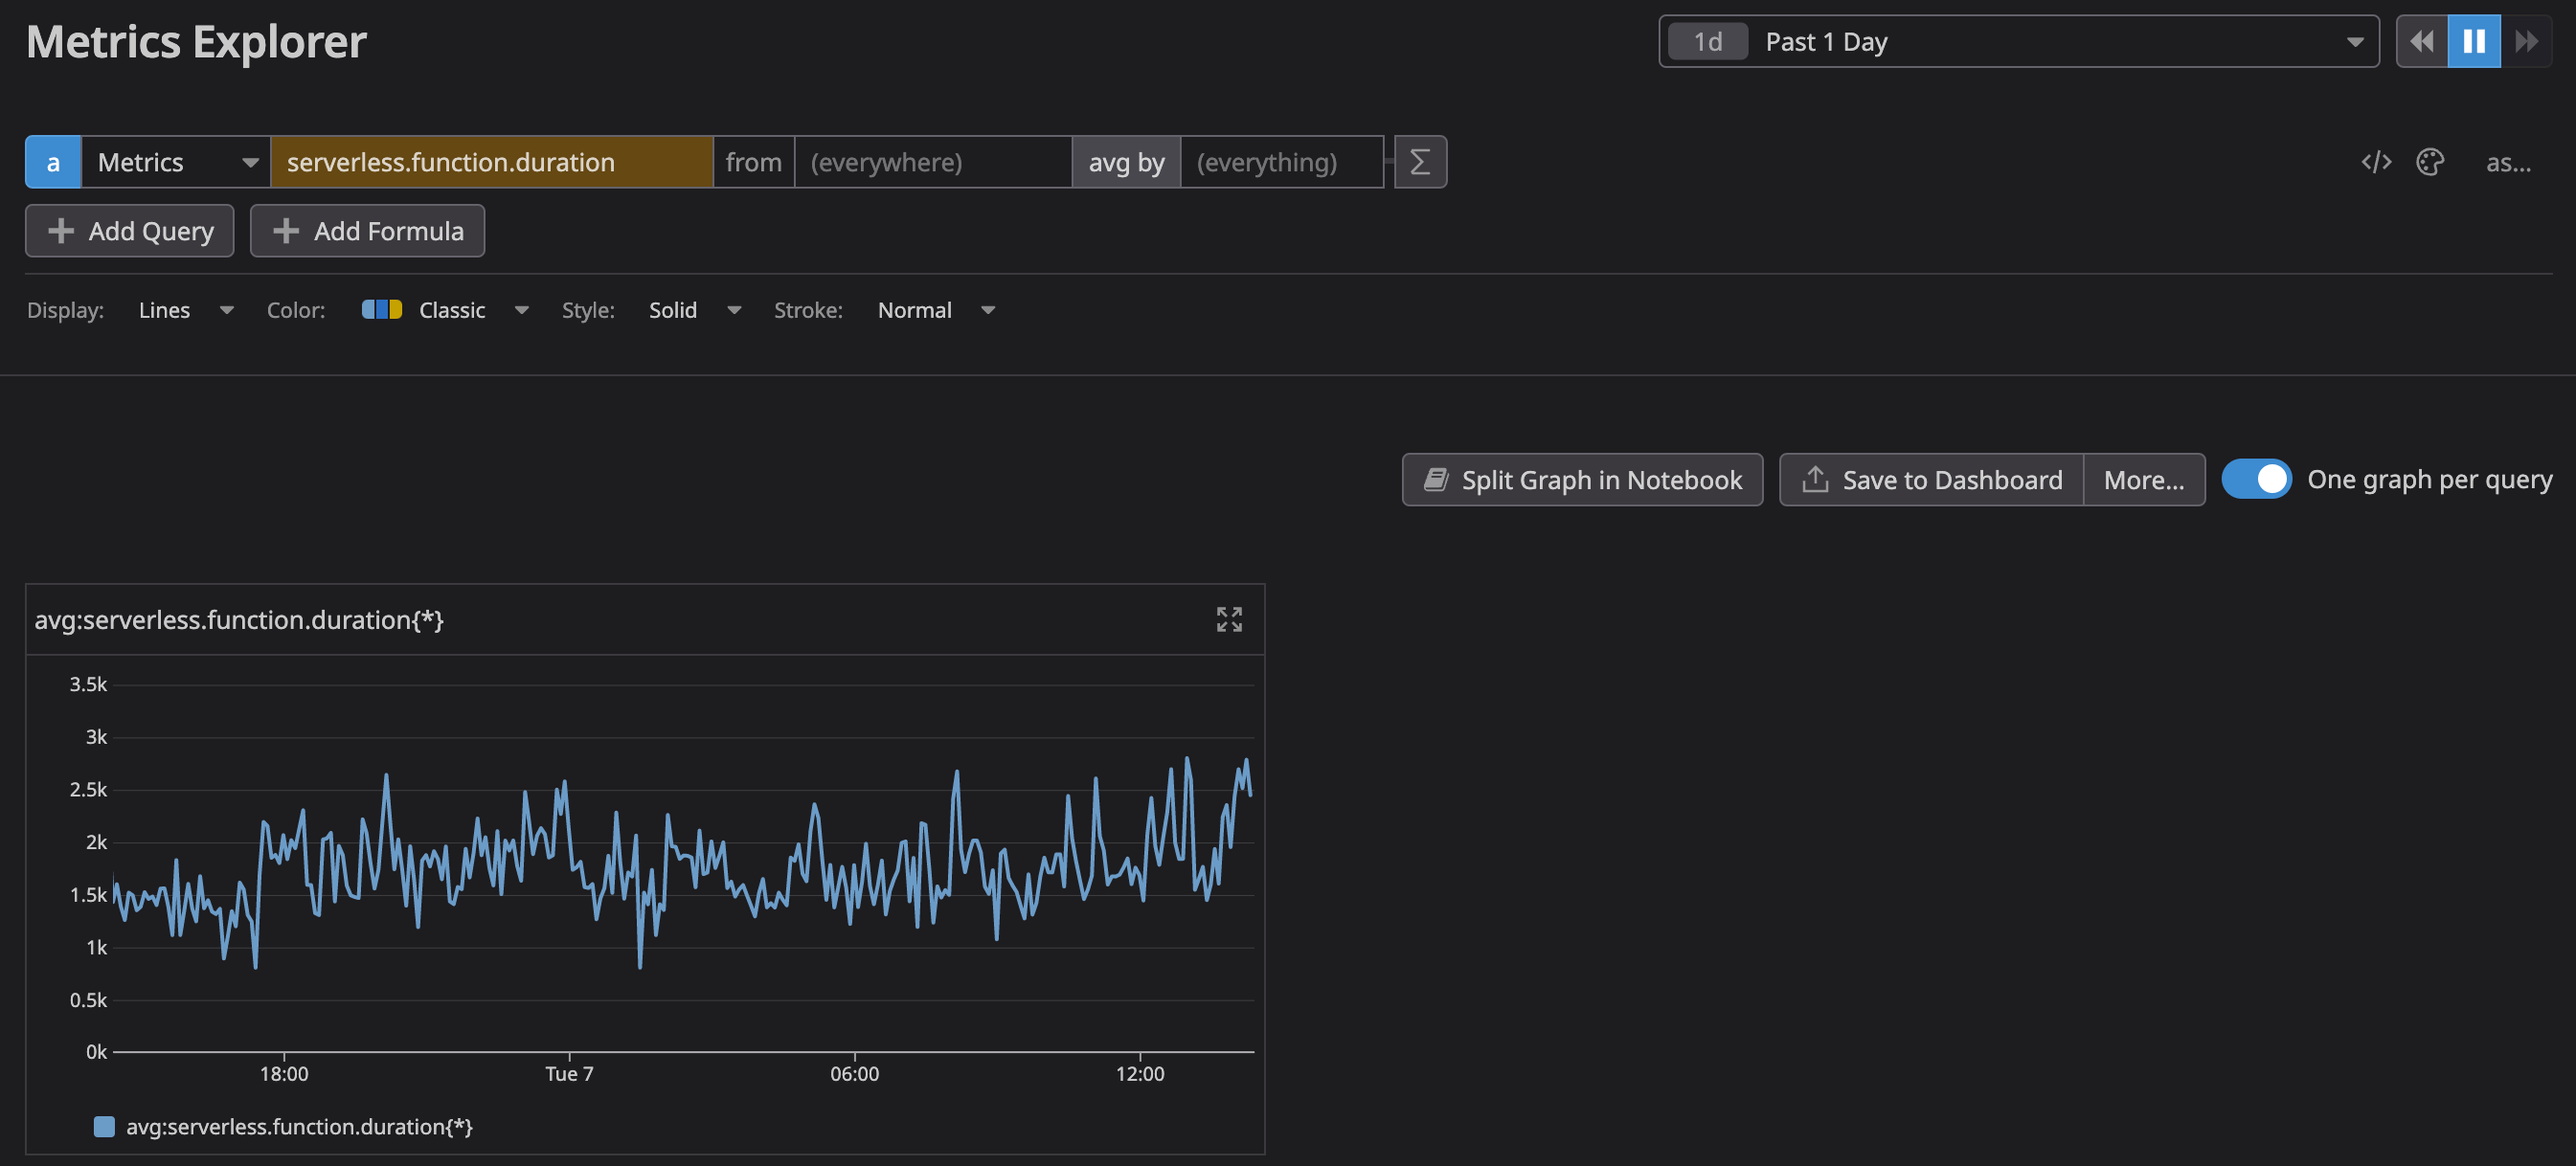
We also use a metric for tracking our Vercel serverless function duration time, which gives us a rough idea of how long a non-cached page takes to generate:
You can also use metrics as input parameters for Monitors.
Monitors
Monitors track values over time and trigger alerts when they deviate from their expected threshold. We use monitors to alert us when something is not working properly, allowing us to take immediate action.
One way we use a monitor is to track the average serverless function duration mentioned above. Originally, we used a fixed number threshold to alert us when the duration exceeded 5 seconds, but it was noisy and triggered a lot of alerts that were not actionable.
As a result, we decided to experiment with Datadog’s anomaly threshold, which uses an algorithm that analyzes past values, trends, and time of day. We set it up so that it alerts us when 100% of the average serverless function duration values are above the upper bounds for 10 minutes:
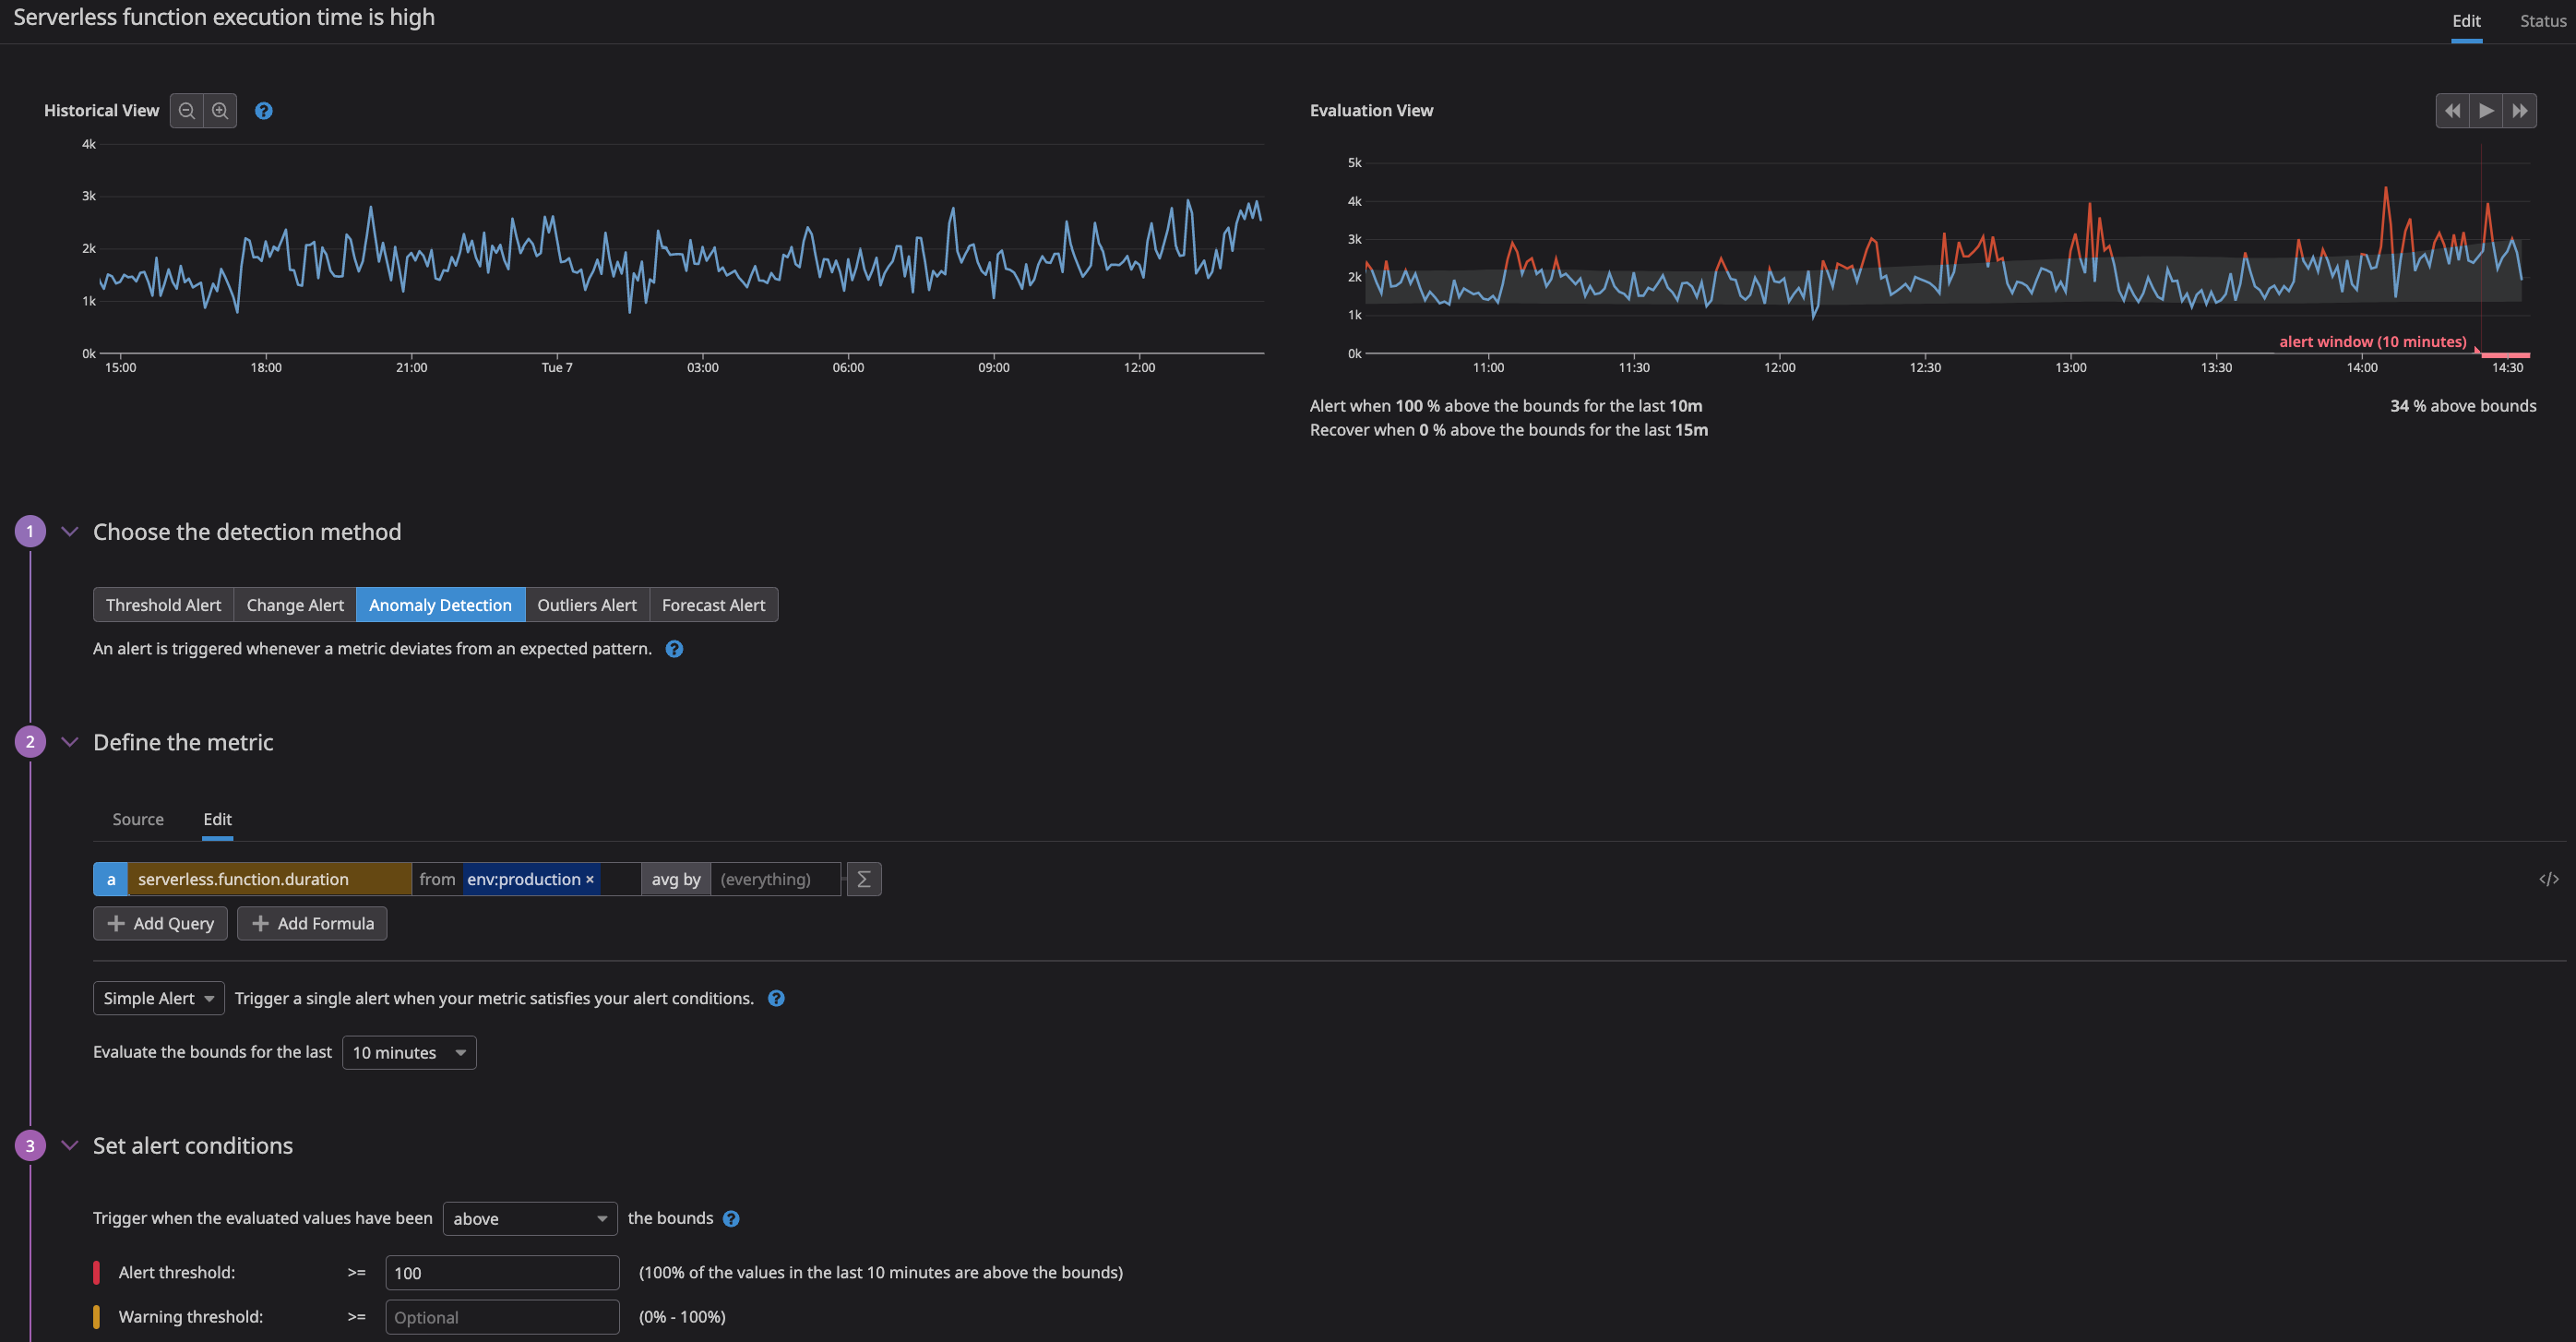
This has proven to be a very effective monitor that acts as a leading indicator for slow site performance and could notify us of an incoming incident.
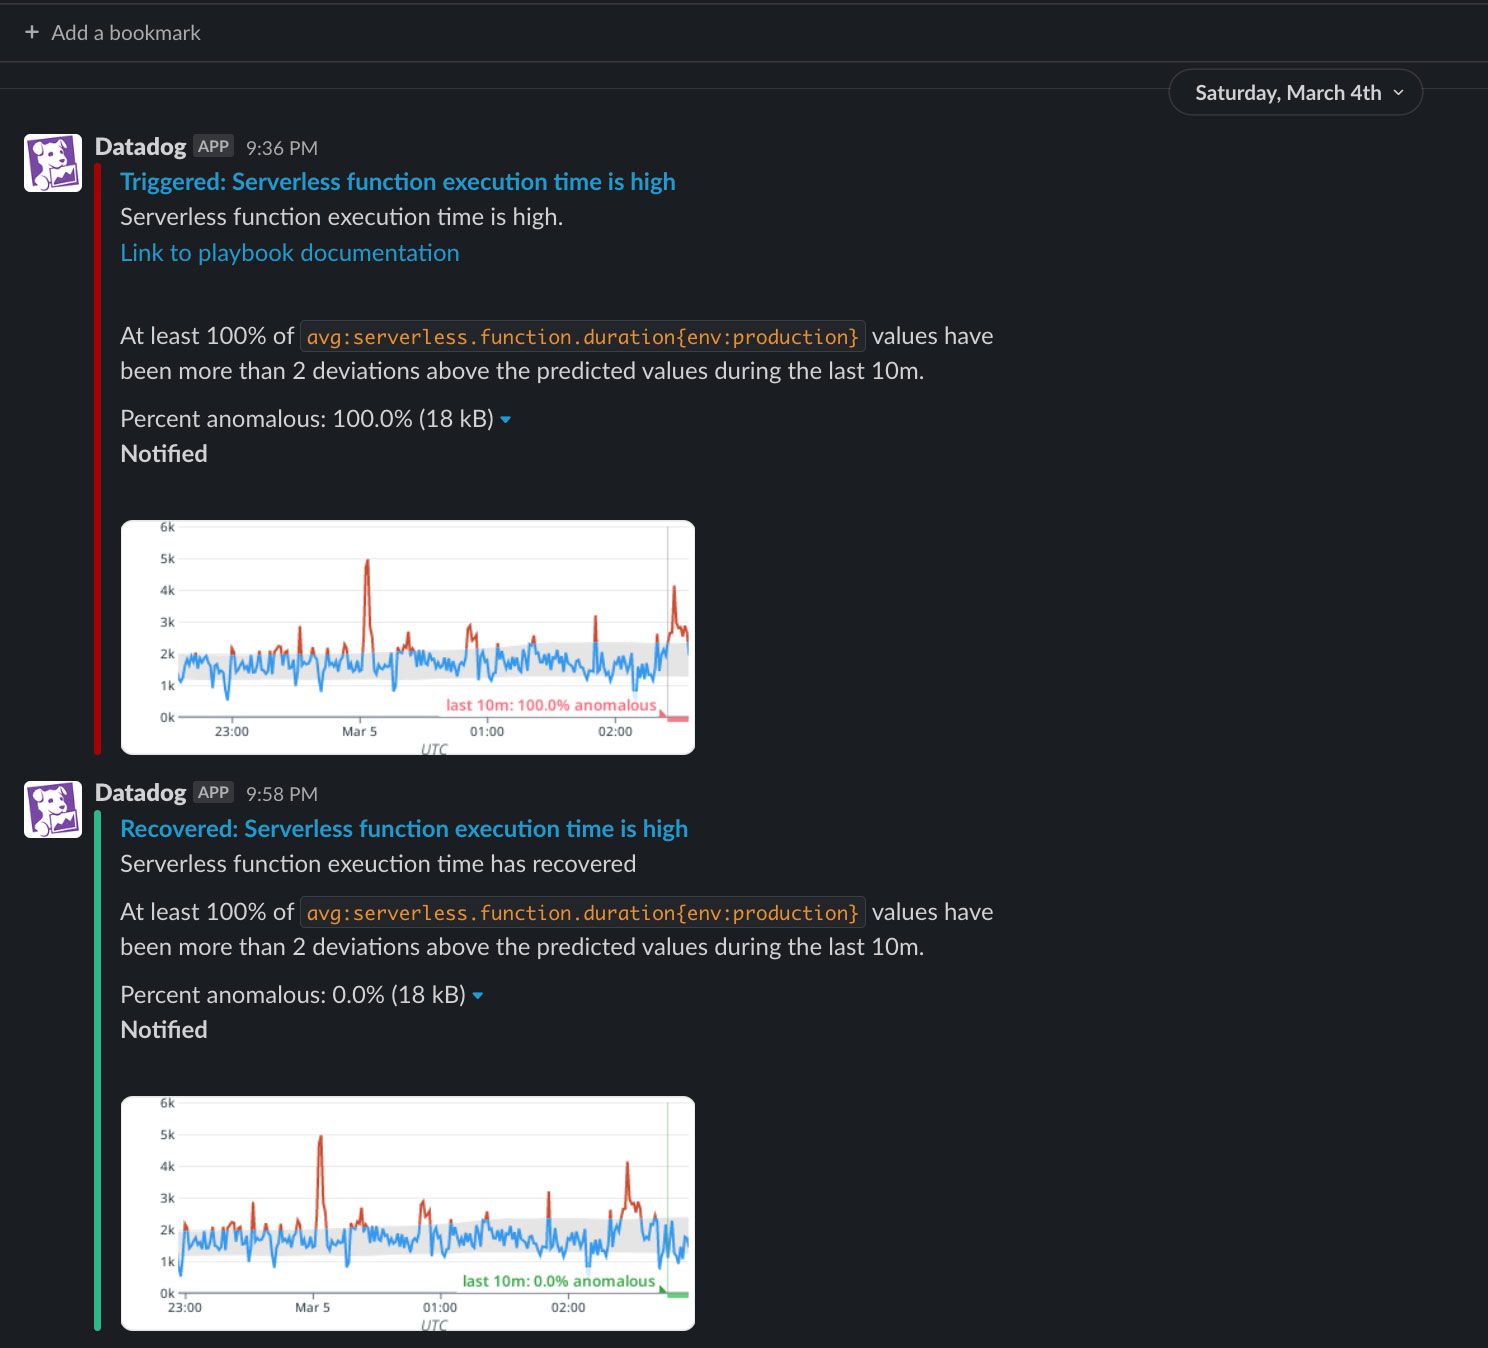
We used Datadog’s Slack integration and pointed it to our team’s Slack channel, which allows us to be immediately notified of any alerts:
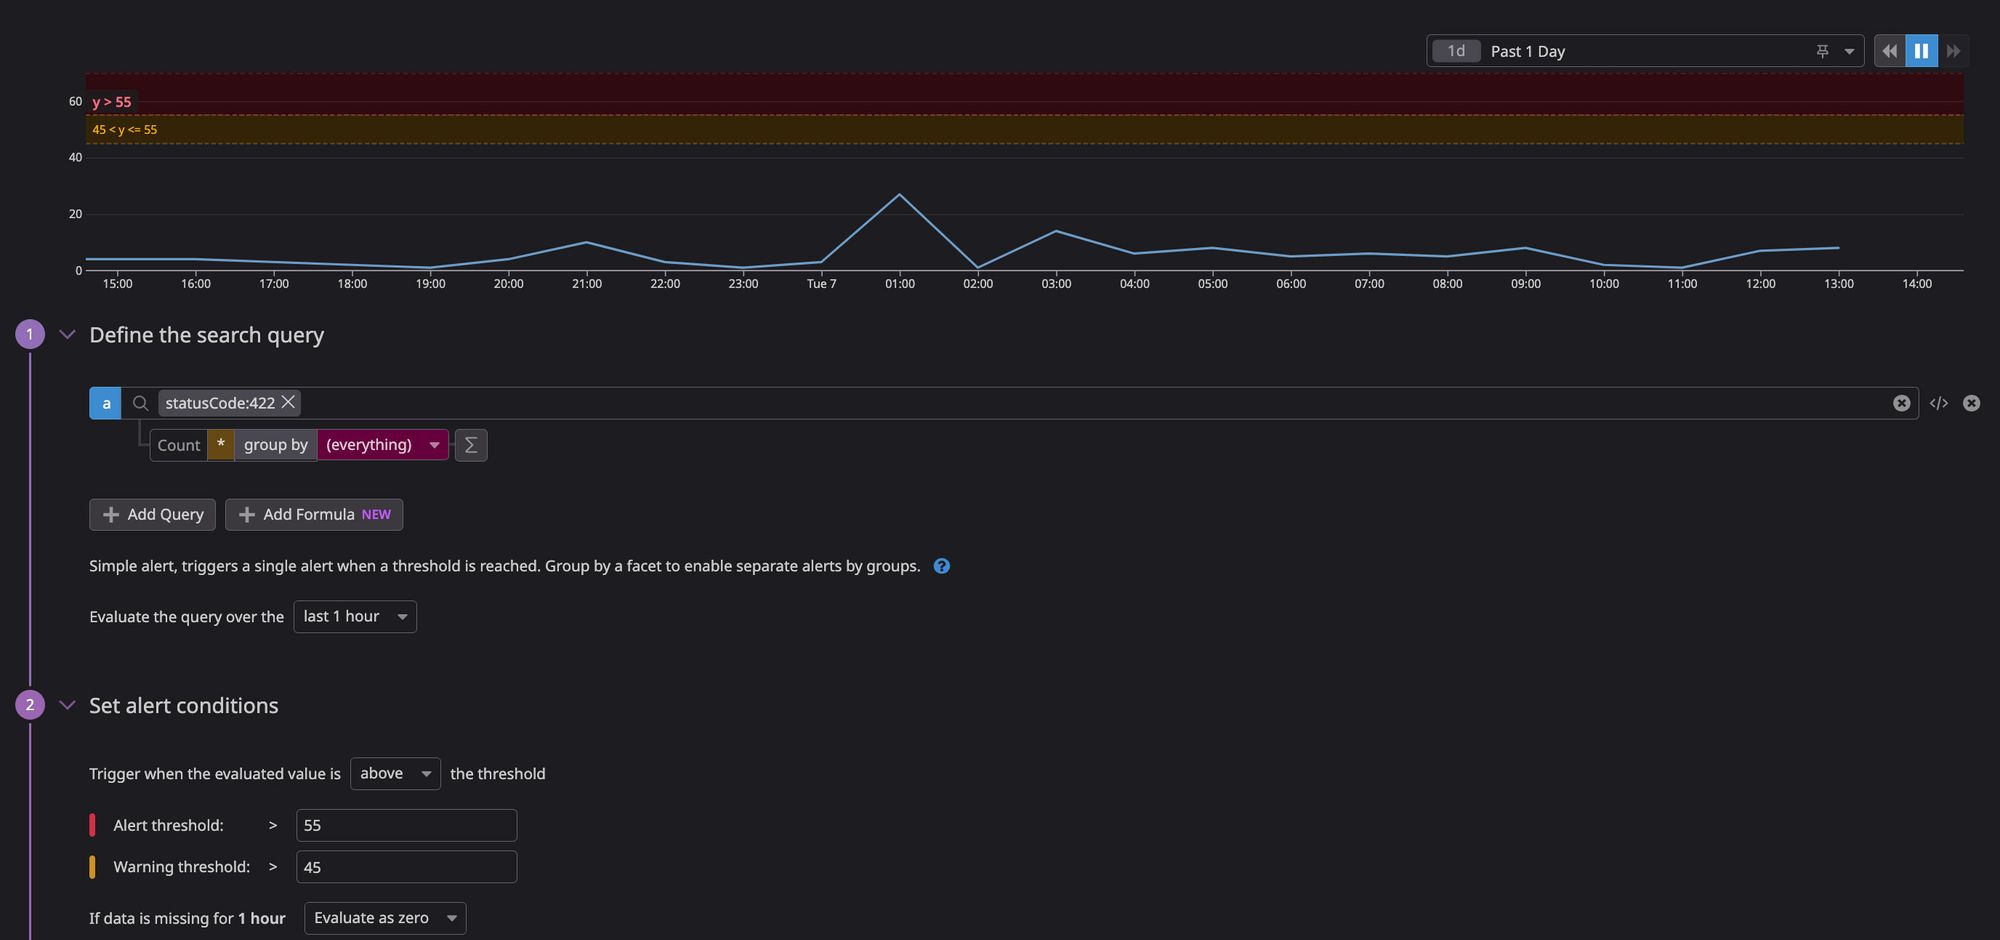
We also set up a monitor that tracks fraudulent trial signups. When there are more than 55 failures in an hour, an alert is posted to Sumo Logic so that the Security team is properly notified and can investigate. They also use this during their weekly fraud reviews:
Dashboards
Dashboards allow you to group important information and view it all in one place. You can add almost anything to a dashboard: logs, metrics, graphs, etc. We created two dashboards that we use to quickly view the overall status of a service: Corp Web KPIs and Trials Observability.
The Corp Web KPIs dashboard shows us request counts, error counts, response times, and our cache hit ratio.
The Trials Observability dashboard shows us the trial error count, failure rates, and our average store creation time.
Dashboards are great because they allow us to easily see the health of our services and make quick decisions.
Conclusion
While these are only a few of the features offered by Datadog, they are extremely powerful and flexible. We are very pleased with our decision to use Datadog due to its ease of use and benefits.
I hope that this has inspired you to consider using Datadog for your own team’s needs. If you have any questions, please feel free to reach out to me on LinkedIn. Thanks for reading!